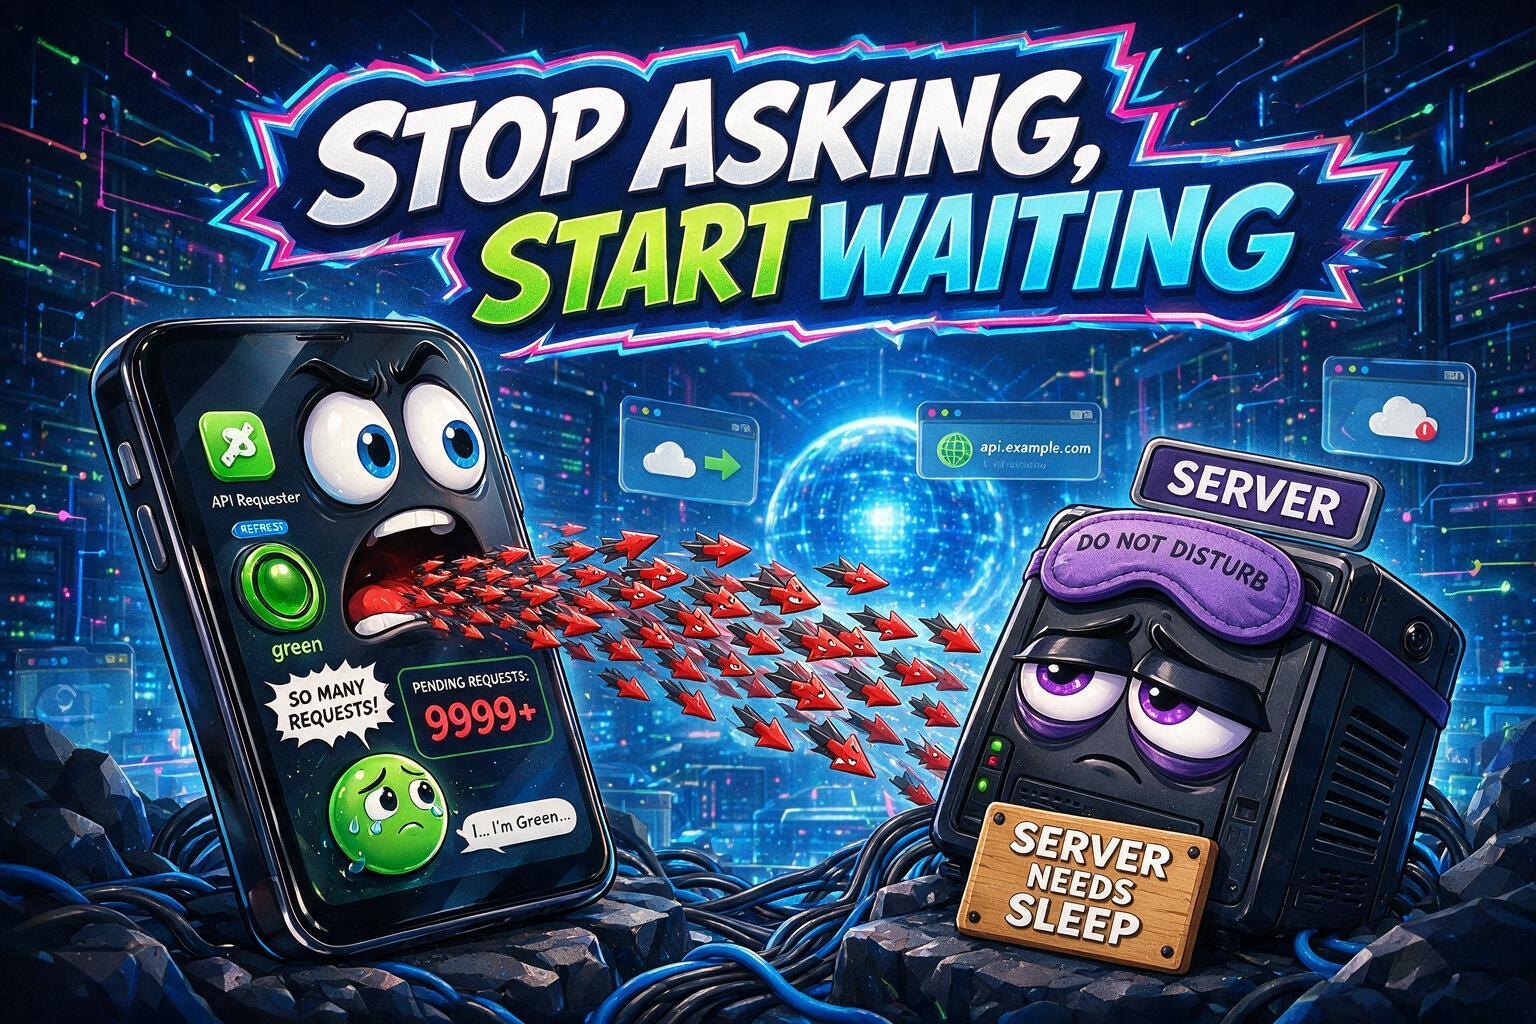
The dashboard was supposed to make the system feel calmer.
One screen. A few useful numbers. A green dot when the service was reachable. The sort of little home-lab panel that says, Everything is fine; go do literally anything else.
Instead, it became the most anxious machine in the house.
The first version polled its backend roughly ten times a second. On a fast local network, the requests usually returned before anyone noticed. On cellular data, Wi-Fi roaming, or a sleepy phone, a response could take longer than the interval between requests. The dashboard did not wait. It launched another request, then another, then another.
Soon the browser was running a tiny stampede:
tick 1: request A -------------------->
tick 2:   request B ------------------>
tick 3:     request C ---------------->
tick 4:       request D -------------->
                       <--- C fails
              <--- A succeeds
Because responses arrived out of order, an old failure could overwrite a newer success. The service was fine. The dashboard announced that it was dead.
A green dot can be a denial-of-service tool
Polling looks harmless because every request is small. The danger is multiplication.
If a new request starts every 100 milliseconds but a slow network takes two seconds to answer, twenty requests can be in flight at once. Add retries and multiple open tabs and the monitoring client becomes load generation. It is the digital equivalent of calling a restaurant ten times a second to ask whether the phone system works.
The problem was not “JavaScript is bad” or “cellular is unreliable.” The problem was that the design had no concept of an unfinished question.
The fix was a single-flight rule:
if a check is already running:
    do not start another one
else:
    run one check with a timeout
    record the result
    schedule the next check afterward
That one rule changed the system from a metronome into a conversation.
One miss is not an outage
The second mistake was treating every failed request as a verdict.
Phones change networks. Radios wake up. DNS caches expire. A tab disappears into the background and returns with its timers distorted. One missed check is evidence of one missed check. It is not proof that the watched service is down.
A useful status display needs memory:
- keep the last known-good result visible for a bounded grace period;
- count consecutive failures rather than panicking on the first one;
- show “stale” before “dead”;
- require a fresh success before declaring recovery;
- slow down when the tab is hidden or the device is offline.
This is not hiding failures. It is refusing to promote noise into truth.
Monitoring software needs a nervous system
The best monitors are not the ones that ask the most questions. They are the ones that understand the cost and meaning of each answer.
A calm client has a timeout, a backoff policy, a maximum concurrency of one for each check, and a state machine more expressive than green versus red. It distinguishes healthy, stale, degraded, offline, and unknown. Most importantly, it does not let an older response travel backward through time and erase a newer one.
The final dashboard did less work and told the truth more often.
That is a recurring engineering lesson: when a monitoring screen screams, check whether the patient is sick—or whether the thermometer is stabbing it ten times a second.